Washington Post is shortsighted in its dismissal of high-speed rail: Post 2

From Fred Dawson on Flickr
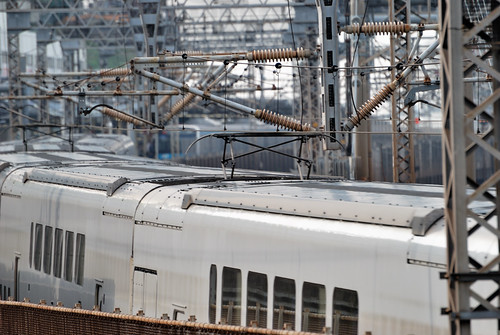
Recently the Washington Post printed an editorial dismissing the need to build high speed rail in the United States (A Lost Cause: The high-speed rail race).  My first post responding to this op-ed, in which I argue that transportation diversity is an important consideration may be found here.  I also responded to an op-ed by Robert J. Samuelson back in November with a 4-part blog series (1, 2, 3, 4) that addressed the issues raised in this op-ed plus some others.

The other problem I have with this opinion article, and that I find with many assertions about how to invest money, is that it is presented in a vacuum.  In this case the author is criticizing Obama's proposal to spend $53 billion on high-speed rail projects.  The implication is that we could choose to just not spend that money and save $53 billion.  The problem is there is no comparison with what the costs are if that investment is not made.

In the US, both our air transport systems and our highways are becoming overwhelmed.  Many billions of dollars will need to be spent just keeping these limping along.  Intelligent investment in high speed rail could offset enormous costs in our air transport system.  For instance, in a previous blog I argued that a well-designed Midwest system could potentially eliminate the need to build a third Chicago airport, which might cost as much as $20 billion.

Without comparing the investment in high-speed rail with what would need to be spent in its absence, the assertion that we could save all this money is worthless.  One cannot say the $53 billion will just be saved, because other transportation will be taken, and costs will be incurred for that instead.

Are those other costs higher than the rail costs?  I don't know for certain, but they are most certainly very high.  Given all the other reasons for investing in rail: environmental, diversification, reduced need for imported oil, reliability, technological advancement, etc., it sure seems like a great investment to me.

Washington Post is shortsighted in its dismissal of high-speed rail: Post 1

from scoutjacobus on flickr
Last week the Washington Post printed an editorial dismissing the need to build high speed rail in the United States (A Lost Cause: The high-speed rail race).  You may recall that I traveled on Spain's impressive high-speed rail system this last summer, which I reported here.  I also responded to an op-ed by Robert J. Samuelson back in November with a 4-part blog series (1, 2, 3, 4) that addressed the issues raised in this op-ed plus some others.

However, I'd like to make even one more point that I think speaks to our need to move aggressively on high speed rail in appropriate corridors.  (I will point out that I do not agree that we should bring high speed rail to 80% of the population of the country, as President Obama has stated.  Rather than set up an arbitrary number like that, we should focus our energies in areas where we can most effectively offset regional air travel.)

from ykanzawa1999 on flickr
A key reason we need to invest in rail is for diversification.  Diversification is an indispensable strategy when it comes to investment portfolios, but for some reason, op-ed writers seem to overlook this important consideration when opining on rail systems.  For decades we have invested in transportation systems that are virtually 100% dependent on petroleum availability to function.  High speed electric rail is not.  Powering trains with electricity allows for fuel flexibility--the energy can come from any source that can generate electric power: coal, solar, wind, nuclear, hydro or whatever.  It is not bound to the price and availability of oil.

Oil is certain to become more expensive and may also become scarcer over the next decade or two, making our existing investments in highways and air travel look like the dot-com boom of the late 90's.  Better to diversify our investments now, since it takes time to get them built and operating--time that we don't really have enough of.

A follow up post addressing another key flaw in their argument will be forthcoming shortly.

Monday What's on the Web: Coal Tattoo

Every Monday I highlight other bloggers or web contributors who are making important or interesting contributions to climate, sustainability, transportation or market transformation. Check back each week for another installment.
----------------------------
I like the name "Coal Tattoo" for this blog hosted by the Charleston Gazette.  I think it captures the idea of how coal creates a permanent mark on our landscape.  This blog covers the coal industry in pretty close detail.  Its primary author is Ken Ward, Jr., who has been covering the coal industry for about two decades.  Last fall, Joe Romm at Climate Progress singled out Mr. Ward as a "Game Changer" in the fight against climate change.  Here's the one-sentence description they use to describe the blog:
This Charleston Gazette blog attempts to build on the newspaper’s longtime coverage of all things coal — with a focus on mountaintop removal, coal-mine safety and climate change.
The blog is quite active and very up to date, averaging about one new post almost every day.  Here are some recent representative posts:

Big thanks to Ken Ward for the work he is doing on behalf of the people of the coal mining regions, the workers, and everyone on the planet who is dependent on a stable climate.


How Much Congestion does the Clean Fuel Exemption Cause on I-66 Inside the Beltway?

Hybrids and other clean-fuel cars are exempted from the HOV requirement on I-66.  All traffic inside the beltway on I-66 must be HOV-2, be a motorcycle or have a clean fuel exemption license plate.  Dr. Gridlock at the Washington Post has argued to remove this exemption to help the HOV lanes function better.  It has been my opinion that the problem was caused more by scofflaws--that is, single occupancy drivers illegally on the road--than the hybrid cars.

Today I had a chance to test my presumption.  I was crossing over I-66 on the pedestrian overpass near Madison Manor park (map).  I tried to notice how many cars were scofflaws but soon realized that it was difficult to tell if there was a child in the back seat or not.  Also, many of the cars had the clean-car license plates.  Then I realized I could read the license plates easily.  Traffic seemed to be traveling about 30-40 miles per hour, slower than free-flowing.  So one could argue that there was congestion, since the HOV lanes were not moving at 55 miles per hour.  So I started counting.

Plates with CF, CX, CY or CZ are exempt from the HOV requirement.  (One can have their vanity plate exempted, too, but there were few of these).  I pulled out a piece of paper and a pen.  Here's what I observed in six minutes from 8:04 to 8:10 AM.
  • 333 cars: 67 with clean-car license plates; 266 without.
  • 1 motorcycle
  • 2 buses
  • 1 18-wheeler (which are illegal on this highway)
  • 1 eastbound 6-car Metro train
Of the cars, 67 had clean car license plates, approximately 20%. 

Here's some quick math extrapolating to an hour and making some assumptions:
  • 2700 HOV cars with 2.2 riders = 6000 people
  • 670 clean-fuel cars with 1.1 riders = 750 people
  • 20 buses with 40 people = 2000 people
  • 10 metro trains with 800 riders = 8000 people
So the clean-fuel cars represent less than 5% of the people being transported along this corridor but represent 20% of the cars.  Would removing that 20% increase flow enough or more than enough to make up the difference.  My intuition says yes, but perhaps a transportation planner can weigh in on the comments.

Monday What's on the Web: Extraordinary Observations

Every Monday I highlight other bloggers or web contributors who are making important or interesting contributions to climate, sustainability, transportation or market transformation. Check back each week for another installment.
----------------------------
Extraordinary Observations is a blog maintained by one of my fellow DC area bloggers named Rob Pitingolo.  He moved to Arlington, Virginia from Cleveland in mid-2010 after graduating from John Carroll University with a degree in Economics. He writes about issues of urbanism, economics, transportation and politics at his blog.  He also occasionally contributes to Greater Greater Washington.

I like his posts because they tend to be short and pithy and make an interesting ("extraordinary" might be a stretch, but--hey--a little hyperbole never hurt anyone) observation.  It's like a little piece of think candy in your day.  Some recent posts include:
Check it out.  You're sure to find a post or two you like.

Green Building Event at the National Building Museum

You never know who's watching, I guess.  I received this email today:

Dear Mr. Offutt,

Since you often write about green building practices, I think that your readers might be interested in attending the lecture For the Greener Good: Life After Plastic, exploring the future of alternative building products for the construction industry. Please find detailed information about the program below. I hope you will share this information with your readers.

Thank you in advance for your consideration and please do not hesitate to contact me if you have any questions or if I can provide you with additional information.
Stacy Adamson
Marketing and Communications Associate

So taking a look at what she sent, I decided to pass it along.  There's an event called For the Greener Good: Life After Plastic being held at the National Building Museum on February 17 from 6:30 - 8:00 PM.  There is a small registration fee.  Click here for more details and information.

Here's a quick blurb:

As a petroleum based product, many believe that as the price of oil rises, the cost of plastic building materials will rise. What is the future of alternate products for the construction industry?

A discussion with:
Blaine Brownell, Assistant Professor, University of Minnesota School of Architecture
Jay Bolus, VP of Technical Operations, MBDC
Lance Hosey, President and CEO, GreenBlue (moderator)
Robert Peoples, Ph.D.,Director of the ACS Green Chemistry Institute®
NBM Logo

Arlington bike data post 2 - Comparing 2009 with 2010 ridership

This is the second in a series of posts analyzing the data that Arlington County has been collecting from its automated bike and pedestrian counters.  My previous post compared ridership from 2009 to 2010.  2010 ridership was higher by 11%, but the weather may have been the deciding factor.  This post looks at the data again from a different perspective.
For this comparison I took the data for the five weeks starting in mid-October through the third week of November.  For each day of the week (Monday, Tuesday, etc.) I charted the highest ridership for that particular day.  That is, I chose the Monday with the highest ridership in 2009 and the Monday with the highest ridership in 2010 regardless of whether it was from the same week.  Five of the seven days of the week showed higher ridership in 2010 than 2009.  The total for all seven high ridership days for each year are:
  • 2009 - 9,826
  • 2010 - 10,617 (+ 8%)
It should be noted that the highest ridership day of all was actually Saturday, Oct 30, 2010 with over 1,600 cyclists.  This number was clearly an anomaly; ridership was skewed by the Stewart/Colbert rally on the mall, so I disregarded it for the sake of this analysis.

For just the five weekdays the totals are:
  • 2009 - 6,085
  • 2010 - 6,590 (+ 8%)
This analysis, which eliminates rain as a factor, shows a gain in ridership but not as much as my previous post.

I performed a separate analysis which was also intended to eliminate rain as a factor.  For this one, I took the seven weeks from mid-October through the first week of December and disregarded all days that had any rain in either year, matching up the days of the week.  There were 20 days that were completely dry in both years, and they are shown in this chart:
This analysis essentially attempts to create an apples-to-apples comparison from year to year--comparing the same days with each other and ignoring days with rain.  Total ridership for these 20 comparable days were:
  • 2009 - 15,970
  • 2010 - 16,180 (+1.3%)
This analysis, in contrast to the other two, shows only a very small gain in ridership from 2009 to 2010.   However, other factors, such as temperature, almost certainly also had an effect on the results.

Monday What's on the Web: Nasa's Eyes on the Earth

Each Monday I highlight other bloggers or web contributors who are making important or interesting contributions to climate, sustainability, transportation or market transformation. Check back each week for another installment.
---------------------------------------
NASA's Climate Change web site is an enormous wealth of information and kept right up to date.  In addition to having the enormity of information about climate that it collects, it does so with some nice graphics and interactive displays.  There's so much on this site, it's impossible to cover it all in one short blog post.  You must visit for yourself.  Unquestionably you will find yourself surfing to an area of interest.  Some of those might be:

Climate Change Evidence: How do we know?
State of Flux: then and now - NASA photos from the past and the present that visually demonstrate the changes taking place on our planet
Mission - Descriptions of the 16 missions NASA has going that are studying our climate.  A great place for space junkies

And there's more, like a sea-level viewer, a climate time machine and other excellent tools. Enjoy!

Comparing Bike Traffic on the Custis Trail - New Data Loggers Provide Great Data

Since the fall of 2009, Arlington County has been automatically collecting data from dedicated bike and pedestrian counters.  The counter on the Custis Trail at the top of the Rosslyn hill near mile post 3.5 (map) has collected the most data--tracking at 15 minute intervals continuously for more than 15 months.  Data has also been collected from the other counter that is located on the Four-Mile Run Trail east of Shirlington near the new I-395 underpass.  I will analyze other data form these counters in future blogs.  Arlington is continuing to add more counters, which will allow for very rich and useful data.

Bike Arlington reported on the CommuterPage blog that data from these counters will be available online with graphing tools allowing one to do their own analysis.

For my first analysis, I compare bike traffic on the trail between 2009 and 2010 (click for larger version).

I compared 5 weeks starting at the first of November through the first week of December.  For the graph, I aligned the days of the week (so 2010 actually starts on Sunday, October 31).  Total ridership over the 5-week period was:
  • 2009 - 24,015
  • 2010 - 26,714 (+11.2%)
That's a pretty good bump for one year.  However, it turns out that 2009 had a lot more rain.  Thanks to David Patton, Transportation Planner for Arlington County, who created an initial chart superimposing rain with ridership for November 2009, I took his idea a little further.  The chart above shows days with rain as darker bars.  2009 had 13 days of significant rain and 3 days with tiny rain.  2010, however, had only 5 days with significant rain and another 7 with a tiny bit of rain.  I do not know what time of day the rain occurred.  So it's hard to know if the increase from '09 to '10 was due to weather, other factors or an actual increase in ridership in general.  On my next post I am going to attempt to remove that variable to see what happens.