----------------------------
One
 of the most observable effects of climate disruption is its affect on ice. The National Snow and Ice Data Center has a web site that contains a lot of excellent data and easy to understand graphics that can shed light and help see the trends in snow and ice cover. A lot of the site is intended for use by scientists, which I am not, so sometimes it takes a little while to find the more easily accessible information. Here's some links to some of that:
Glacier
 Photograph Collection - Just what it says, a collection of photographs of glaciers, including a special collection of comparative photos taken years apart. These photos may be used by the public as long as credit is given to NSIDC.
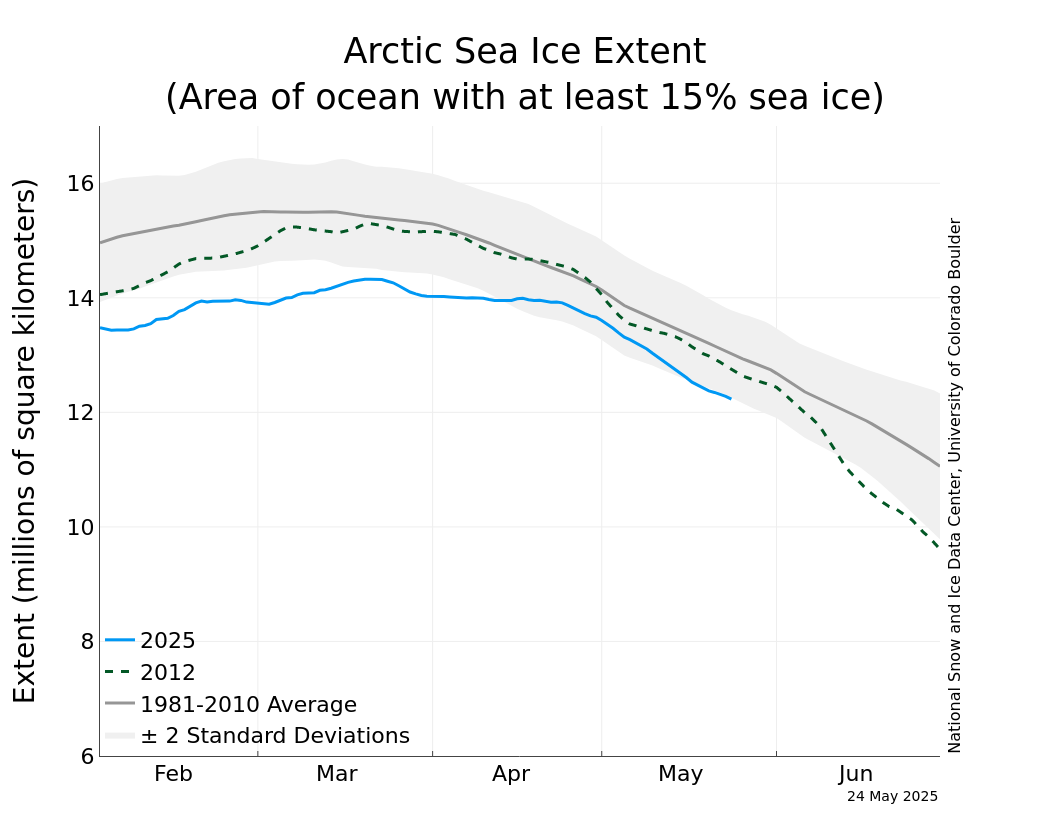
The Sea Ice Index - Shows a daily picture of sea ice extent with comparison lines against the long-term average.
 By clicking on the "Sea Ice Trends in Extent" graph on the right (be sure to also change to daily view), you can get excellent graphics like this one.
Education Resources - For those who are wanting to learn more about snow and ice, there are some useful resources here, much of it available on the Internet for free.
Monthly Highlights - A good way to keep up with what is going on at NSIDC and with the sciences associated with ice and snow, is to follow their monthly highlights.
The NSIDC website is truly enormous, with way more information than I have had the time to investigate. Hopefully you will have fun finding some interesting things for yourself.


No comments:
Post a Comment